Planning
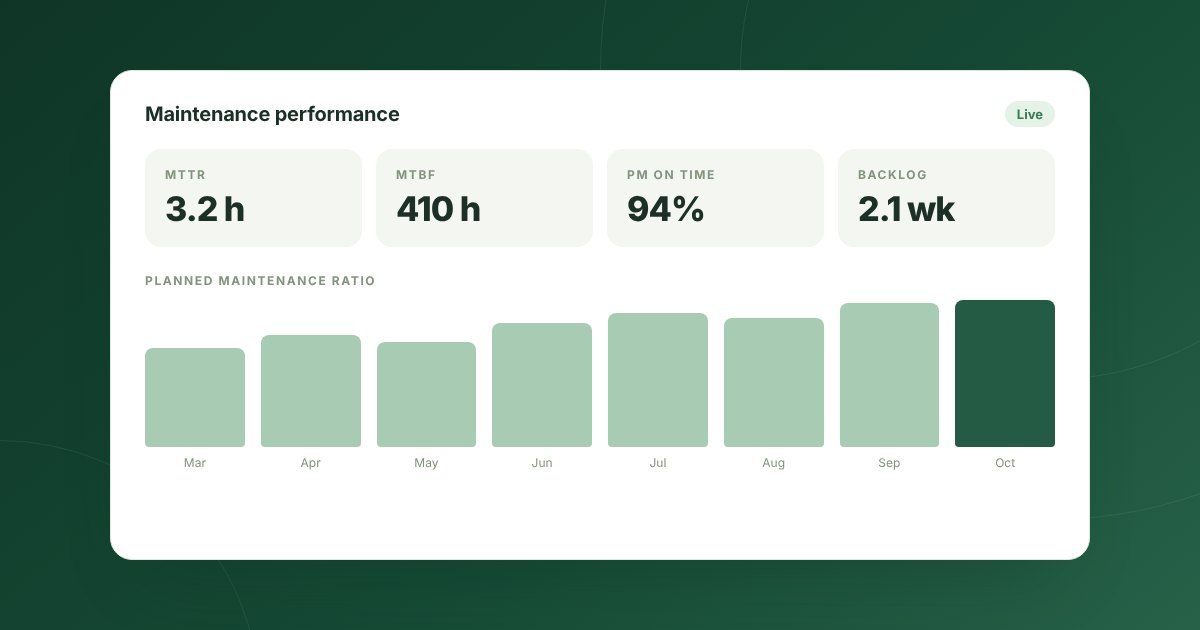
- Planned maintenance ratio
Planned work as a share of all maintenance hours. A rising ratio means fewer surprises.
- PM compliance
Preventive jobs done on time, as a share of those due. If it drops, failures usually follow.
- Backlog
Work waiting to be done, in weeks of crew capacity. Too little means idle teams; too much means risk.
Speed
- Mean time to repair (MTTR)
Average time from failure to working again. It shows how fast you respond and fix.
- First-time fix rate
Jobs closed on the first visit. Low rates often point to missing parts or information.
Reliability
- Mean time between failures (MTBF)
Average running time between breakdowns. It shows whether assets are getting more reliable.
- Availability
The share of time an asset is ready for use. This is the number operations cares about most.
Cost
- Maintenance cost per asset
Labour, parts and contractors per asset. It shows where the money goes and when replacing is cheaper than repairing.
Traps to avoid
- Reporting averages only. One asset can hide behind a good average.
- Typing KPIs into a spreadsheet. If the number is not calculated from the work itself, nobody will trust it.
- Too many KPIs. If a number never leads to a decision, remove it.
- No targets. A KPI without a target is just a statistic.
Make KPIs part of the weekly routine
Review planning KPIs every week with supervisors, reliability KPIs every month with engineers, and cost KPIs every quarter with finance. Each review should end with two or three actions, for example a shorter interval for an asset that keeps failing, or a spare part to keep in stock.
How Mintema helps
Because work orders, inspections, parts and sensor readings live on one platform, Mintema calculates these KPIs from the work itself. Thirty ready dashboards cover executives, maintenance managers and finance, and the report designer sends them on schedule.